Table of Contents
- I. Tutorial: Make Marked Graph models executable with the GEMOC Studio
- 1. What is expected at the end of this tutorial
- 2. Install the projects defining the Marked Graph AS and CS
- 3. Set up an xDSML project
- 4. Define the Execution Semantics
- 5. Execute a Model
- 5.1. Launch the Modeling WorkBench
- 5.2. Import the project with a sample model
- 5.3. Select the Modeling perspective
- 5.4. View the wikipedia example
- 5.5. Create a Launch Configuration
- 5.6. Launch the execution of the model
- 5.7. Select a logical step
- 5.8. Stop the execution
- 5.9. How to visualize the state of the model?
- 6. Define Animation Viewpoint
- 7. Using breakpoints
- 8. Going further…
List of Figures
- 1.1. Expected animation for Marked Graph models
- 2.1. Importing existing projects from the archive file
- 2.2. Abstract Syntax (Metamodel) of MarkedGraph
- 2.3. Example of a Marked Graph model (from wikipedia)
- 3.1. Create a GEMOC Concurrent xDSML Project
- 3.2. Define the name of the project
- 3.3. Define the properties of the xDSML
- 3.4. Content of the Melange file
- 4.1. Abstract Syntax of MarkedGraph extended with Execution Data (ED) and Execution Functions (EF)
- 4.2. Create a DSA Project
- 4.3. The Melange file with references to aspects implementing ED and EF
- 4.4. Definition of the DSA (ED and EF)
- 4.5. Corrected Melange file
- 4.6. Create a DSE Project
- 4.7. Initializing the DSE project
- 4.8. Template of the ECL file
- 4.9. Definition of the DSE (events and constraints)
- 5.1. Select "run / run Configurations"
- 5.2. Define the Marked Graph Modeling Workbench configuration
- 5.3. Importing the existing sample project from the archive file
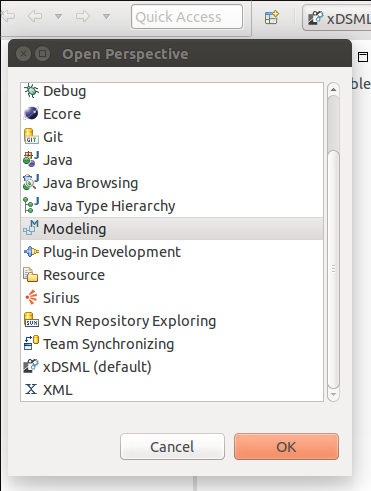
- 5.4. Select the 'Modeling' perspective
- 5.5. Open the Sirius graphical view of wikipedia example
- 5.6. Select Debug / Debug Configurations
- 5.7. Define the configuration to run the wikipedia example
- 5.8. The wikipedia model is just started
- 5.9. Logical Steps Decider
- 5.10. Change the displayed console
- 5.11. Gemoc Engine Status
- 5.12. Initial State
- 5.13. Execute a logical step (initIt)
- 5.14. Execute a logical step (t1 fired)
- 5.15. Execute a logical step (t2 fired)
- 6.1. Launch the Animator wizard
- 6.2. Select "Extends an existing diagram description"
- 6.3. Select the viewpoint to extend
- 6.4. Information of the animation viewpoint
- 6.5. Initial makedgraph-animation.odesign file
- 8.1. Graphical declaration of the placeReadWriteDef relation
- 8.2. Automaton defining the placeReadWriteDef relation.
This tutorial aims at demonstrating the power of the GEMOC studio to define an executable semantics and provide graphical animation for a DSML. It relies of the marked graph language.
The following animation shows the expecting results of this tutorial: according to the fired transitions, tokens move from place to place.

The domain model is implemented with several EMF projects that you need to import into your workspace. A graphical editor defined with Sirius is also available to visualize Marked Graph models.
Download the provided archive containing the projects and unzip it. Then, with the GEMOC Studio, select import… / General / Existing Projects into Workspace and import all the projects from the archive file.
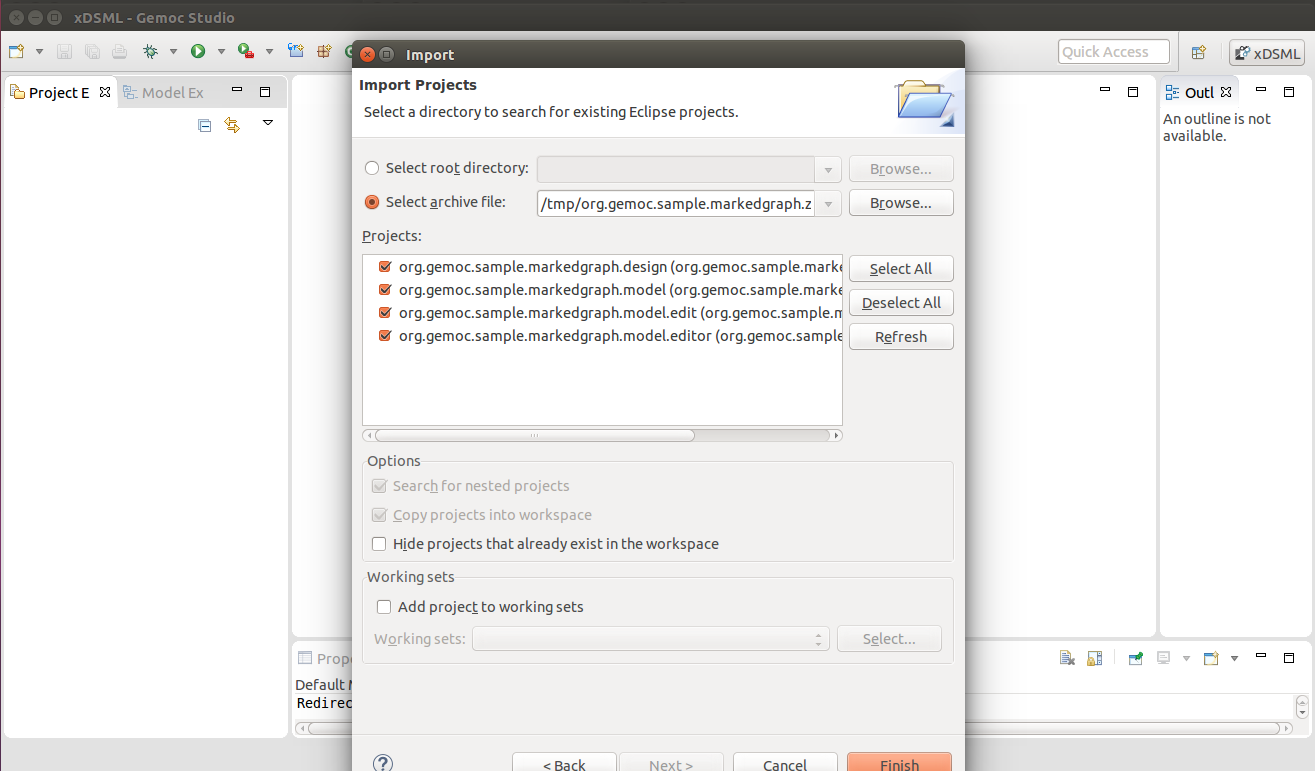
Here is the archive containing all the projects that will be created during this tutorial.
Marked Graph is a kind of Petri net in which every place has exactly one incoming arc and exactly one outgoing arc. As a consequence, it a concurrent language (several transitions may be fired) and has no conflict.
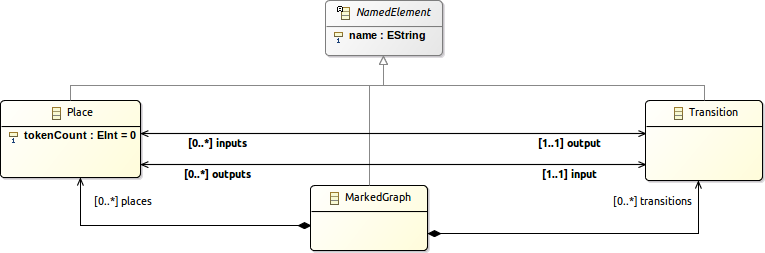
The Domain Model, also called Abstract Syntax or Metamodel, defines :
- A marked graph as a set of places and transitions.
- Each Place has exactly one input transition and one output transition and a token count.
- A transition has several input places and several output places.
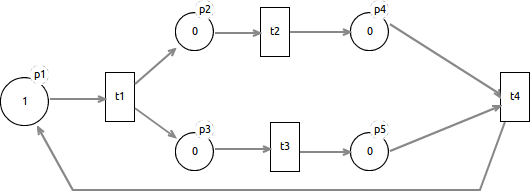
The graphical concrete syntax draws places as circles and transitions as squares. Inputs and outputs of places and transitions are designated by arrows. The following picture shows the graphical representation of the Marked Graph model of wikipedia (using a graphical syntax defined using Sirius).
In this section, we first create an xDSML project for MarkedGraph and initialize it with the provided Abstract Syntax (AS) and Concrete Syntax (CS).
First, check that the current perspective is "xDSML" (top right of Eclipse frame). The perspective can be changed thanks to the menu "Window > Open Perspective > Others".
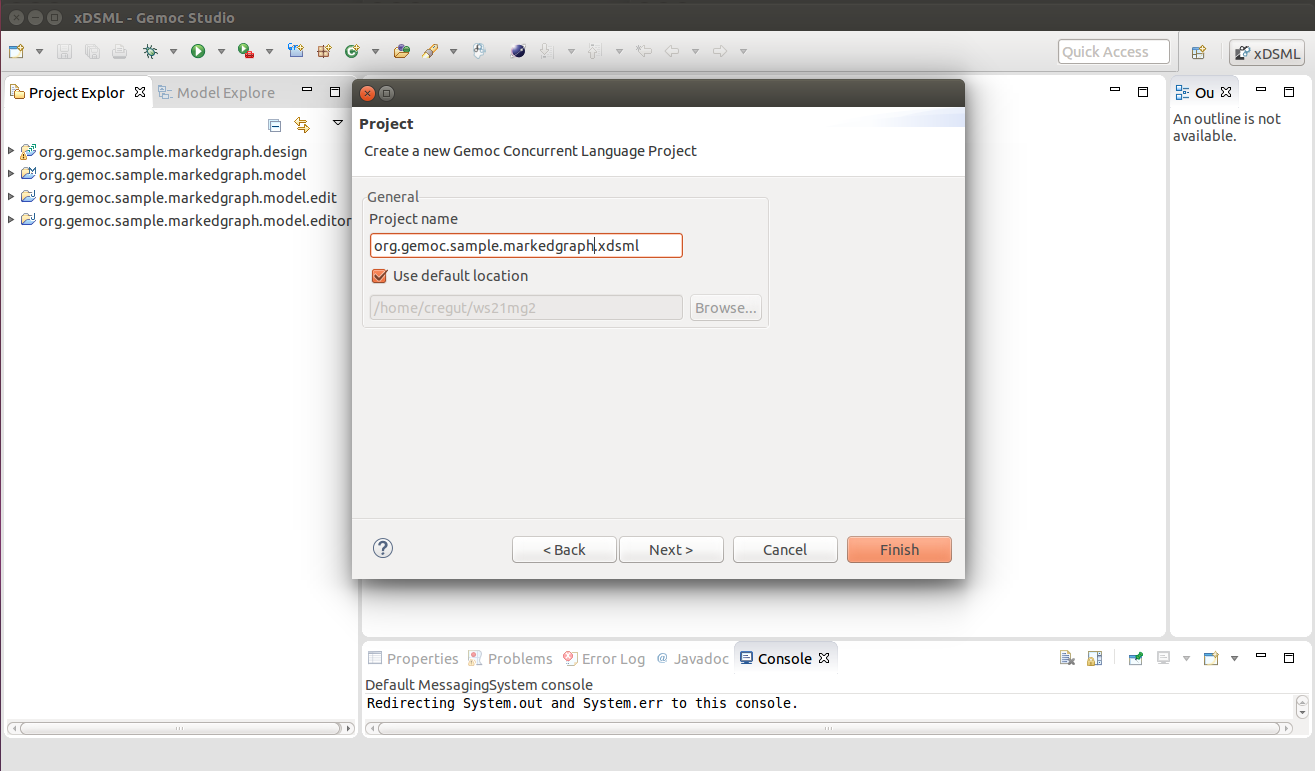
Create a "New xDSML project" (New > Project > GEMOC Project / new GEMOC Concurrent xDSML Project).
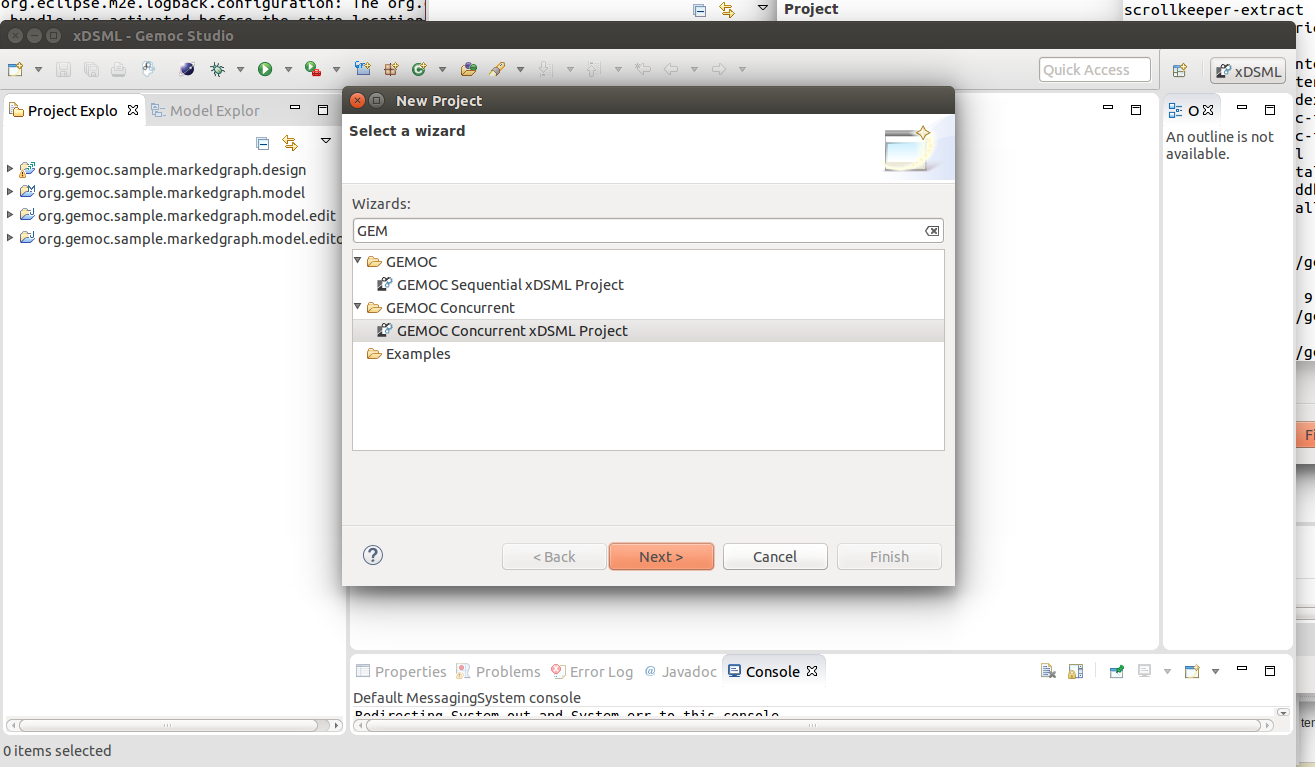
The first dialog of the wizard asks for the name of the project. Define it as org.gemoc.sample.markedgraph.xdsml.
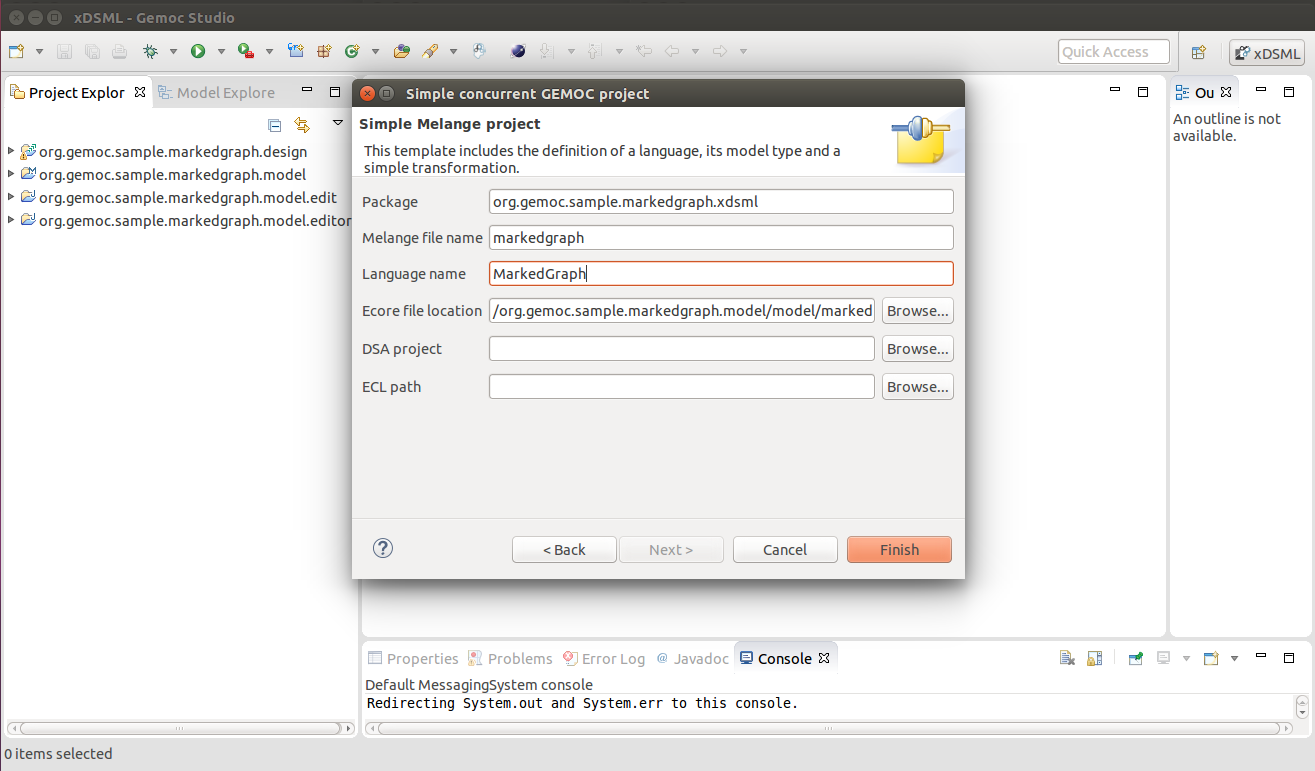
Click on Next and define the properties of the language (markedgraph). The 'Package' property is already defined (based on the project name). The othe properties include the name of melange file (used to link together the different parts on an xDSML), the name of the language and the location of the Ecore file. The two other properties 'DSA projects' and 'ECL path' will be created latter in this tutorial.
Use 'markedgraph' for the Melange file name, 'MarkedGraphL' for the Language name and select the markedgraph.ecore file by Browsing the 'org.gemoc.sample.markedgraph.model' project (found in 'model' directory).
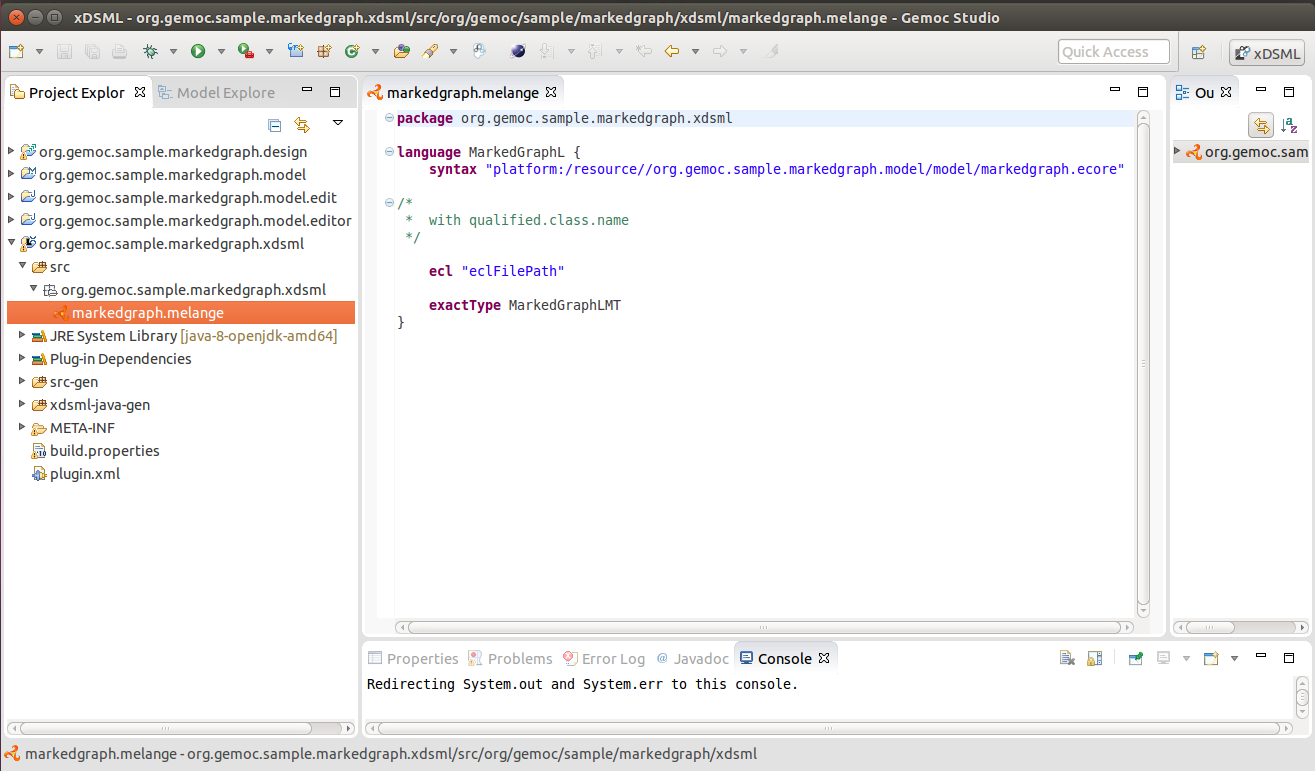
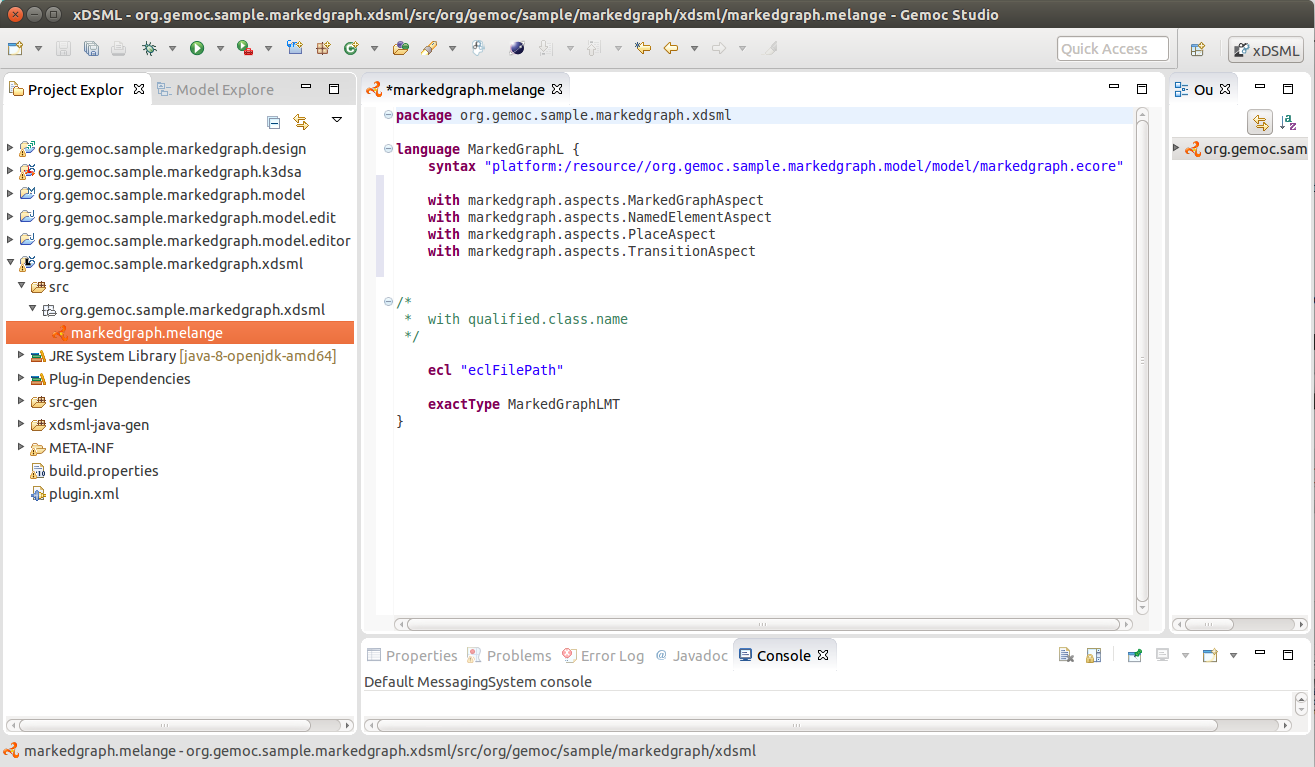
The Melange file summarizes all the important resources used in an xDSML project (which are part of and managed by other projects). Completion (CTRL-SPACE) can be used to launch wizard but it will not be used in this tutorial. The Melange file is found in the 'org.gemoc.sample.markedgraph.xdsml' project in the 'src' directory.
A transition can be fired if there is at least one token in every of each input place. When a transition is fired, one token is removed from each of its input places and one token is added to each of its output places. Several transitions can be fired as the same time.
Defining the execution semantics consists in implementing the previous behavior. In the GEMOC approach, it is split in different concerns:
- The definition of Execution Data (ED) like the runtime count of tokens in a place and Execution Functions (EF) like fire a transition. ED and EF constitute the DSA.
- The definition of the model of concurrency as a set of events and constraints on these events. It is the MoCC concern that is defined in a DSE project (using ECL, Event Constraint Language) possibly completed with MoCCML projects to define libraries of constraints.
- The mapping between the DSA and the MoCC.
In the current version of the GEMOC studio, the MoCC and the mapping are tightly coupled and described in ECL (Event Constraint Language).
During execution of a MarkedGraph, the number of tokens of a place has to be recorded and changed according to the fired transitions. Thus, we have to manage an execution data (ED) called runtimeTokenCount and an execution function (EF) on Transition called fire(). Furthermore, the runtimeTokenCount of each place must be initialized at the start of the execution. It is the purpose of the EF called initialize() on the MarkedGraph element.
The DSA of Marked Graph is composed of :
- one ED called runtimeTokenCount defined on Place . It represents the number of token in a place when the model is executed.
- one EF called initialize() defined on MarkedGraph. It initializes the runtime token count of each place with the initial token count.
- one ED called fire() on Transition. It to remove one token from each of its input places and add one token to all its output places.
At the moment, we need to complete the AS (markedgraph.ecore) with the ED and EF. In the next release of the GEMOC Studio this step replaced by the use of Melange to automatically extend the AS with ED and EF.
The ED and EF are already defined on the provided metamodel. Thus, there is no need to add the 'runtimeTokenCount' ED on Place, 'fire()' on Transition and 'initialize()' on MarkedGraph.
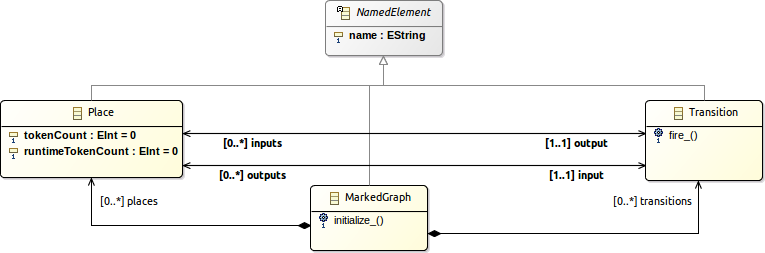
Figure 4.1. Abstract Syntax of MarkedGraph extended with Execution Data (ED) and Execution Functions (EF)
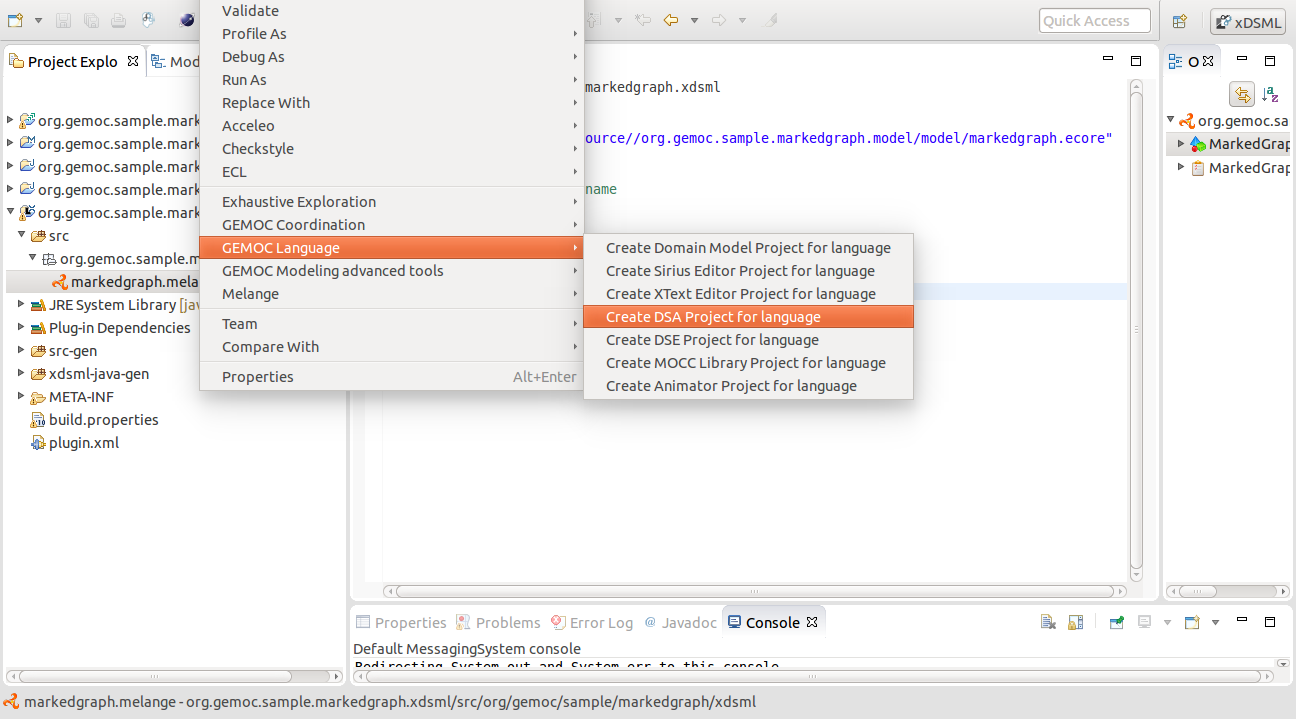
In the Project Explorer, right click on any file of the xDSML project and choose GEMOC Languge > Create DSA Project for language to start the wizard.
The wizard first add for the language: select 'MarkedGraphL' and click OK. On the next screen, the project name is already initialized. Click 'Finish' and the 'org.gemoc.sample.markedgraph.k3dsa' is created and the Melange file is completed with references to aspects implemented the ED and EF.
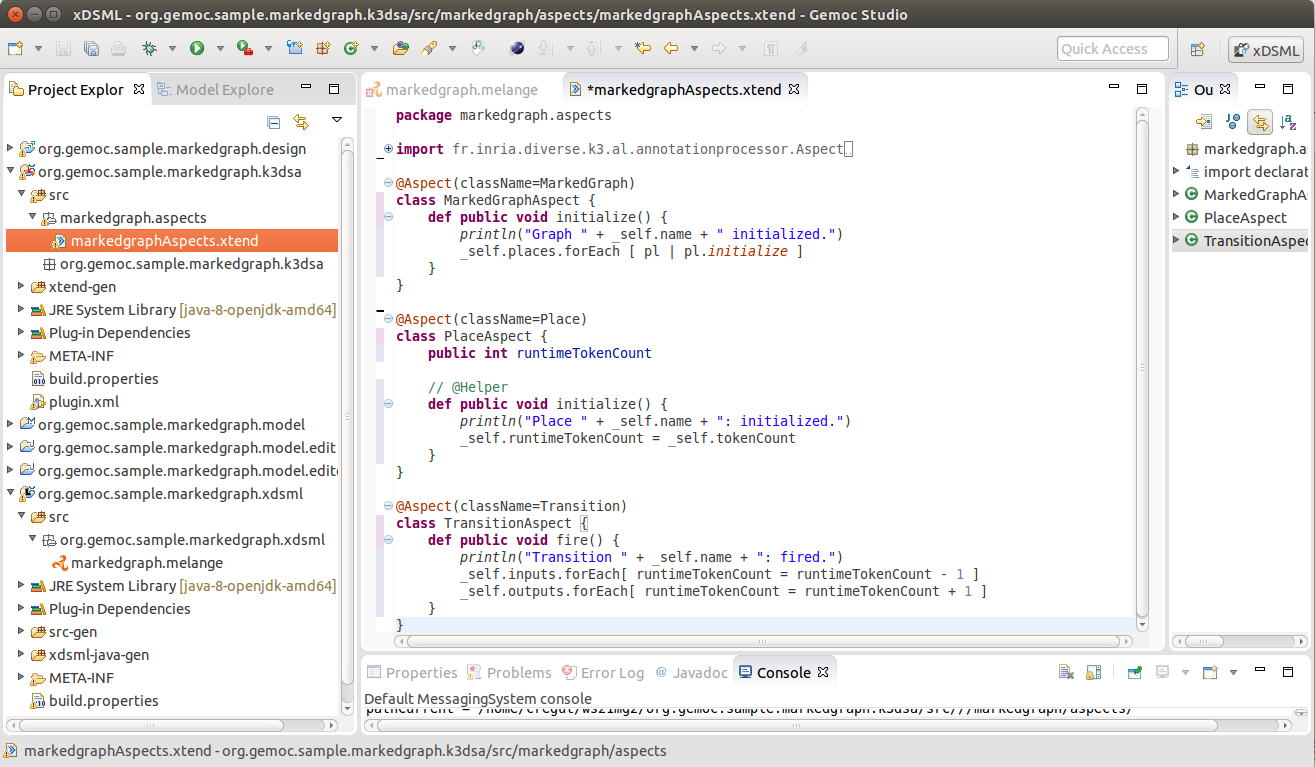
Open the markedgraphAspects.xtend file. It is located in the org.gemoc.sample.markedgraph.k3dsa project in src/markedgraph.aspects. The file has been initialized with a template that can be discarded and replaced with the following text.
package markedgraph.aspects

import fr.inria.diverse.k3.al.annotationprocessor.Aspect
import markedgraph.MarkedGraph
import markedgraph.Place
import markedgraph.Transition

import static extension markedgraph.aspects.PlaceAspect.*

@Aspect(className=MarkedGraph)
class MarkedGraphAspect {
	def public void initialize() {
		println("Graph " + _self.name + " initialized.")
		_self.places.forEach [ pl | pl.initialize ]
	}
}

@Aspect(className=Place)
class PlaceAspect {
	public int runtimeTokenCount

	// @Helper
	def public void initialize() {
		println("Place " + _self.name + ": initialized.")
		_self.runtimeTokenCount = _self.tokenCount
	}
}

@Aspect(className=Transition)
class TransitionAspect {
	def public void fire() {
		println("Transition " + _self.name + ": fired.")
		_self.inputs.forEach[ runtimeTokenCount = runtimeTokenCount - 1 ]
		_self.outputs.forEach[ runtimeTokenCount = runtimeTokenCount + 1 ]
	}
}
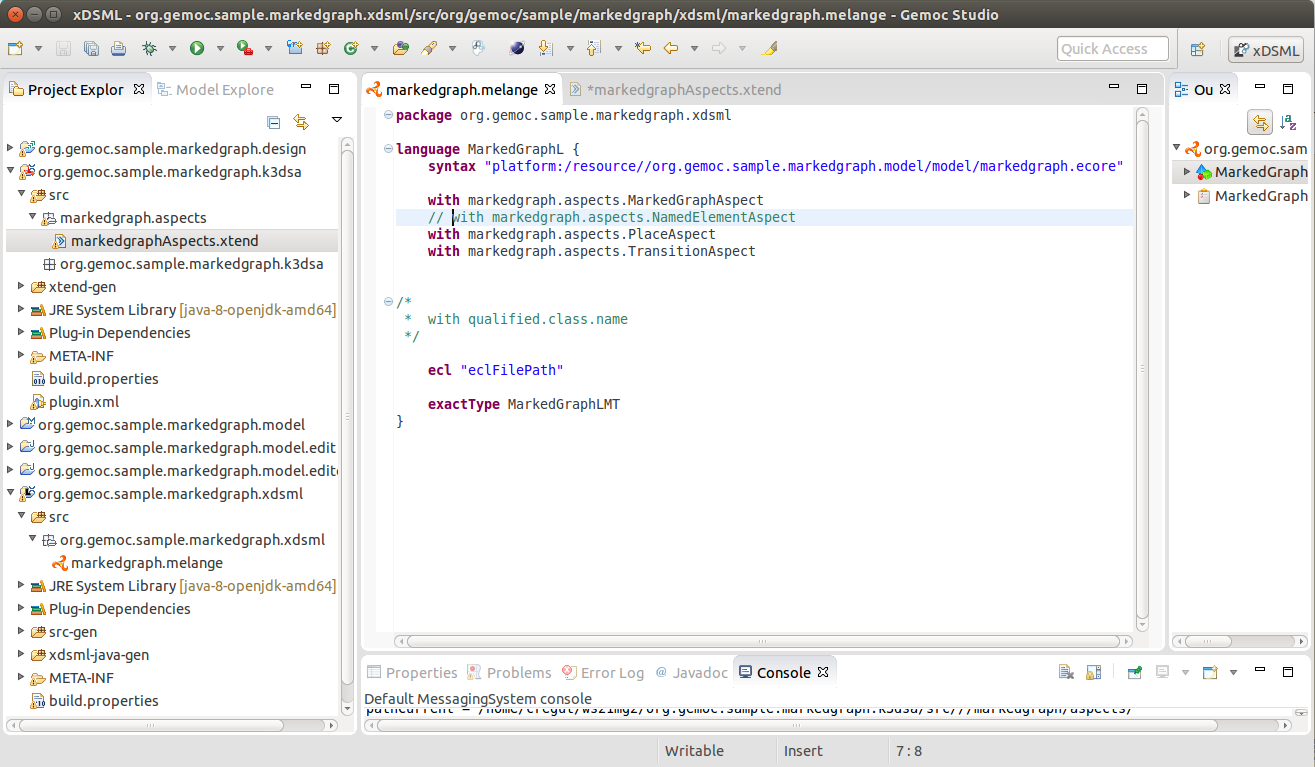
There is an error in the Melange file because no aspect has been defined on the NamedElement metaclass. Just comment out the corresponding line.
The purpose of the DSE project is to define events (called DSE) on AS elements that will trigger EF calls when they occurs. Furthermore, constraints can be defined on these events to define when they may occur.
Like for the DSA Project, right click on any file of the xDSML project and choose GEMOC Languge > Create DSE Project for language to start the wizard.
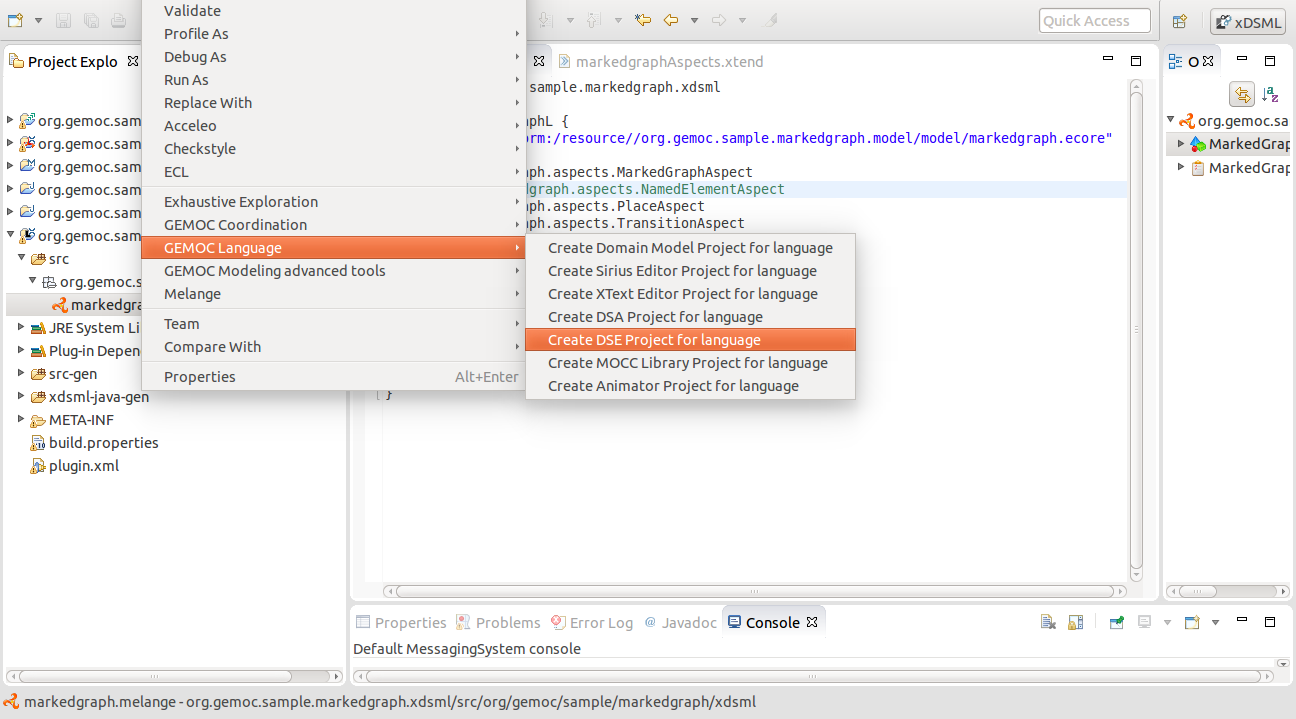
Then :
- Select the MarkedGraphL language and click OK.
- On the next screen of the wizard, click Next (the project name is already initialized org.gemoc.sample.markedgraph.dse).
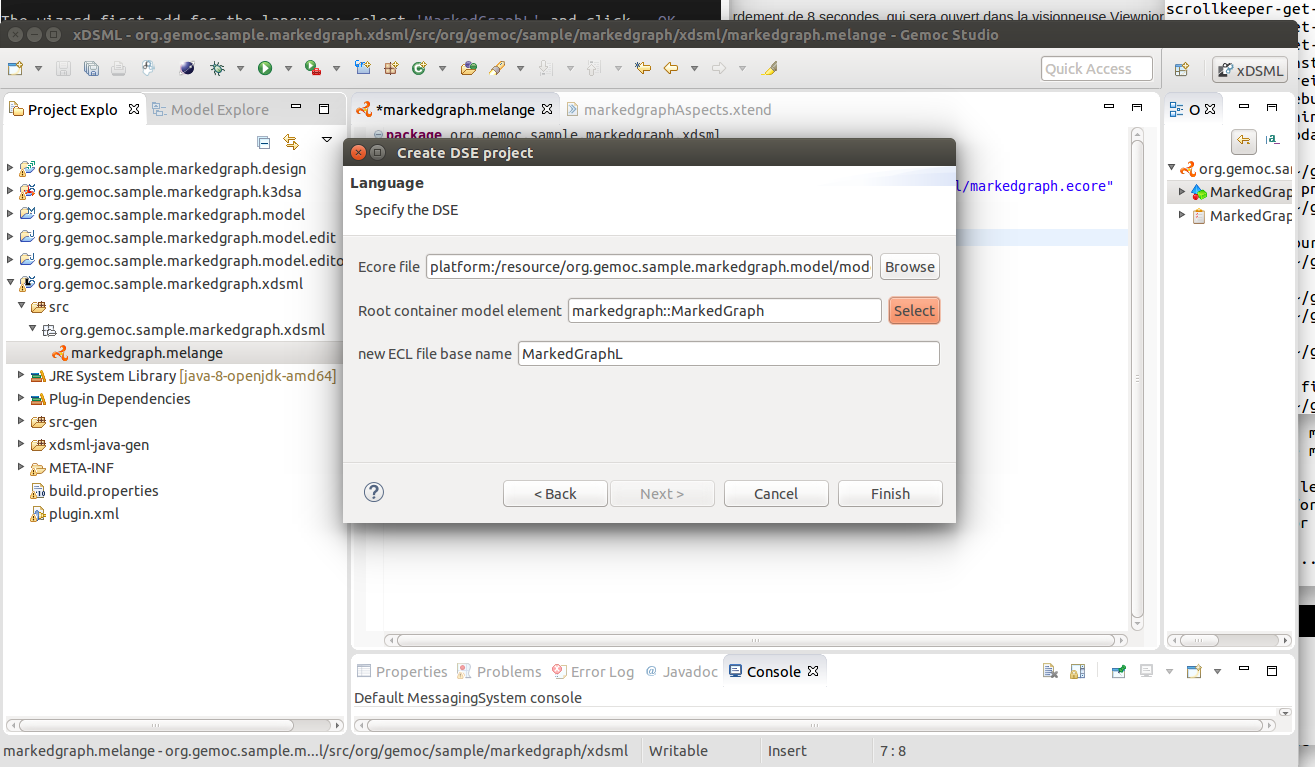
On the last screen, complete the required fields:
- The MarkedGraph Ecore file has already been initialized, just click on Browse.
- Select the root container : MarkedGraph::MarkedGraph
- Set the New ECL file basename is already set to 'MarkedGraphL'
Once the wizard has been completed, the org.gemoc.sample.markedgraph.dse project is created with a template for the MarkedGraphL.ecl file (found in the ecl directory).
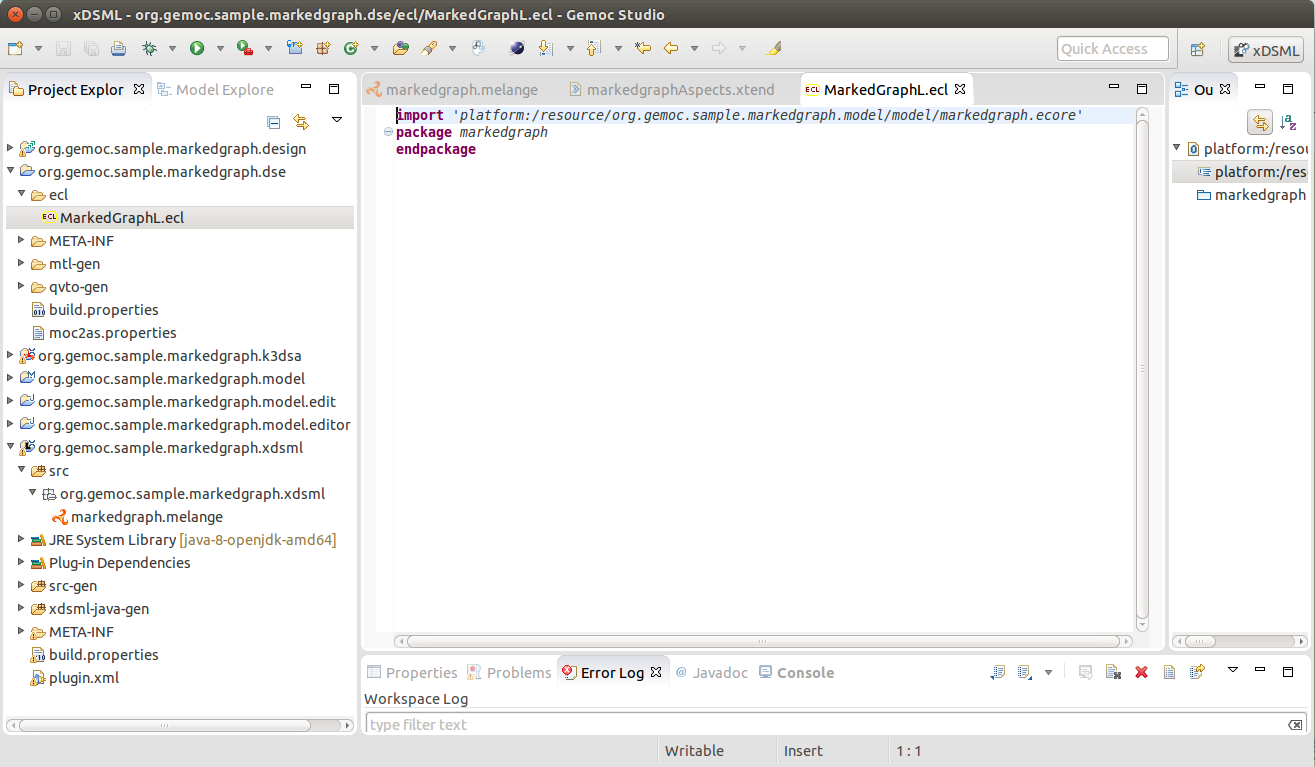
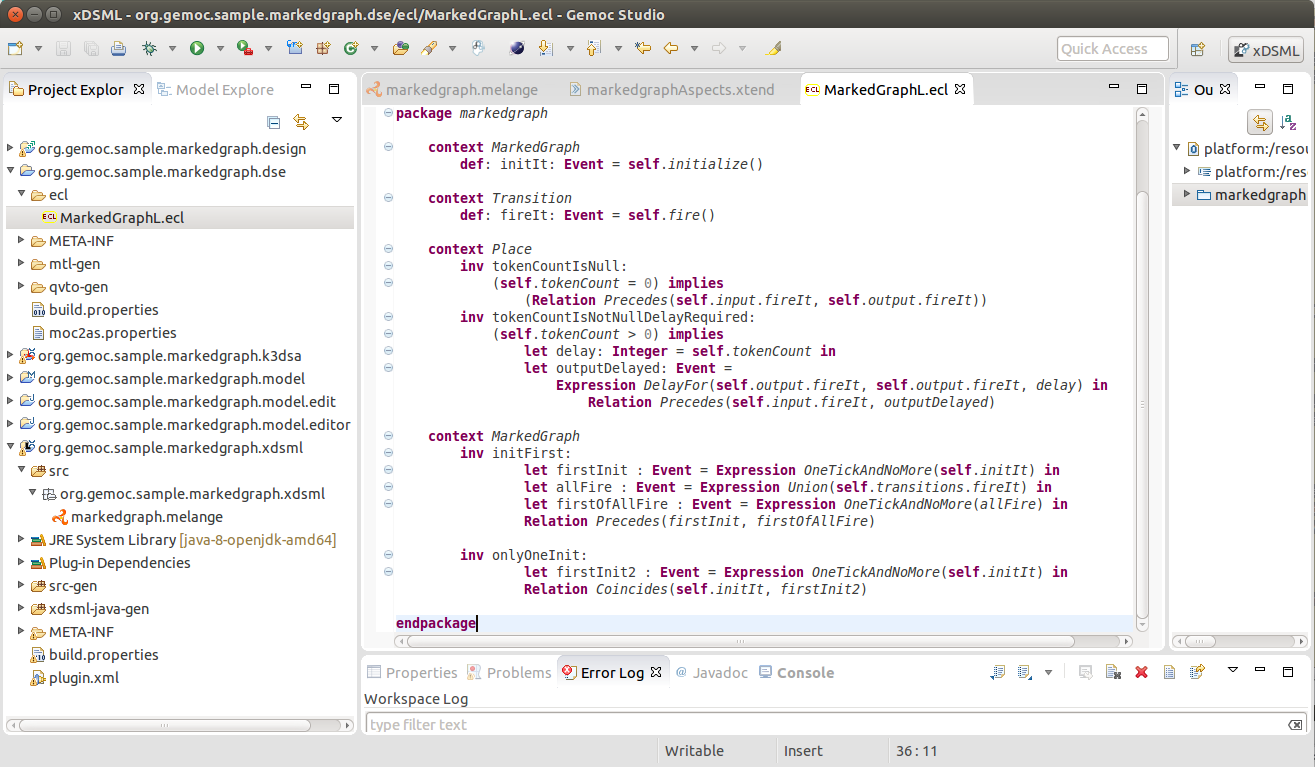
Replace the content of the ECL file with the following code (explanations on this code are given bellow):
The file MarkedGraphL.ecl.
import 'platform:/resource/org.gemoc.sample.markedgraph.model/model/markedgraph.ecore'

ECLimport "platform:/plugin/fr.inria.aoste.timesquare.ccslkernel.model/ccsllibrary/kernel.ccslLib"
ECLimport "platform:/plugin/fr.inria.aoste.timesquare.ccslkernel.model/ccsllibrary/CCSL.ccslLib"

package markedgraph

	context MarkedGraph
		def: initIt: Event = self.initialize()

	context Transition
		def: fireIt: Event = self.fire()

	context Place
		inv tokenCountIsNull:
			(self.tokenCount = 0) implies
				(Relation Precedes(self.input.fireIt, self.output.fireIt))
		inv tokenCountIsNotNullDelayRequired:
			(self.tokenCount > 0) implies
				let delay: Integer = self.tokenCount in
				let outputDelayed: Event =
					Expression DelayFor(self.output.fireIt, self.output.fireIt, delay) in
						Relation Precedes(self.input.fireIt, outputDelayed)

	context MarkedGraph
        inv initFirst:
                let firstInit : Event = Expression OneTickAndNoMore(self.initIt) in
                let allFire : Event = Expression Union(self.transitions.fireIt) in
                let firstOfAllFire : Event = Expression OneTickAndNoMore(allFire) in
                Relation Precedes(firstInit, firstOfAllFire)

        inv onlyOneInit:
                let firstInit2 : Event = Expression OneTickAndNoMore(self.initIt) in
                Relation Coincides(self.initIt, firstInit2)

endpackage
This step has three main purposes:
First, it specifies DSE in the context of metaclasses of the AS. For Marked Graph xDSML, we identify 2 DSE:
- fireIt: defined in the context of a Transition
- initIt: defined in the context of a MarkedGraph
Then, it links them to EF from DSA --- when a DSE will occur the associated EF will be executed.
- fireIt is linked to the EF 'fire' of Transition
- initIt is linked to the EF 'initialize' of MarkedGraph
Finally, it defines constraints on the DSE to rule the possible scheduling. Constraints generally rely on relations which are defined in MoCC libraries. Here constraints are expressed in CCSL and only relies on relations and expression from the CCSL core library.
- A first constraint applies on the fireIt events. It is depends on the number of token in a place. Indeed, if there is no tokens, then the fireIt of the output transition can only occur after the fireIt event of the input transition has occured. It is expressed by the first invariant defined in the context of a Place. If there is some tokens in a place, then the fireIt event of the output transition may occur as many times as there is tokens in this place. After, it will only occur when the fireIt on the input transition of the place has occured. It is expressed using the DelayFor expression in the second envariant of Place.
- Two other constraints are defined in the context of the MarkedGraph element. The first one expresses that the first initIt event must occur before any fireIt event. The second one expresses that the initIt event can occur only one time.
Note
Please notice that, as often, DSE are defined at the language level, but at runtime they are instantiated as MSE on each object instance of the metaclasse they are defined on. For example, there will be one fireIt MSE for each Transition element of MarkedGraph model. For the wikipedia example, there will a fireIt event for transitions t1, t2, t3 and t4. In the same way, constraints apply to the MSE.
The executable MarkedGraph Language is now defined. We can use the GEMOC Modeling Workbench to execute MarkedGraph models. In the next section, we will see how to define a graphical animation a MarkedGraph model.
First, we will create a run configuration. Select "run / run Configurations".
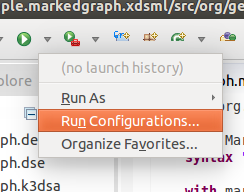
Double click on "Eclipse Application" and change the name "New Configuration" into "MarkedGraph Modeling Workbench".
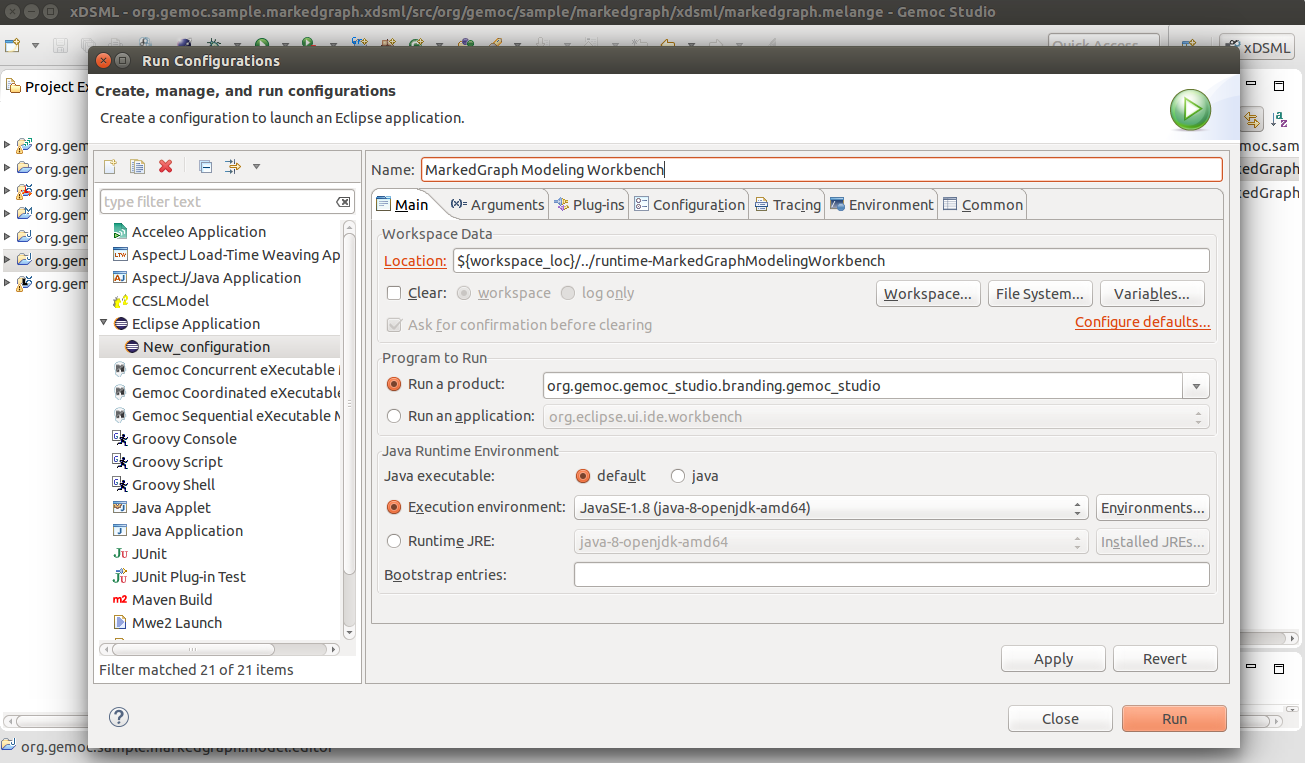
Then click "Run" to start the new runtime Eclipse which indeed corresponds to the Modeling Workbench for MarkedGraph.
Import the modeling project org.gemoc.sample.markedgraph.sample in the Modeling Workbench (Import / General / Existing project into Workspace). It contains the wikipedia.markedgraph file which corresponds to the Wikipedia example.

- Select "Window / Open Perspective / Others…". Alternatively, you can click on the little icon on the right of "Quick Access" field, on the left on the current perspective (top right of the main frame).
- Select "Modeling" in the list.
To open the graphical visualization of the wikipedia MarkedGraph example, double-click on wikipedia.aird resource, then open the tree view until "wikipedia MarkeGraph diagram" appears. Open it.
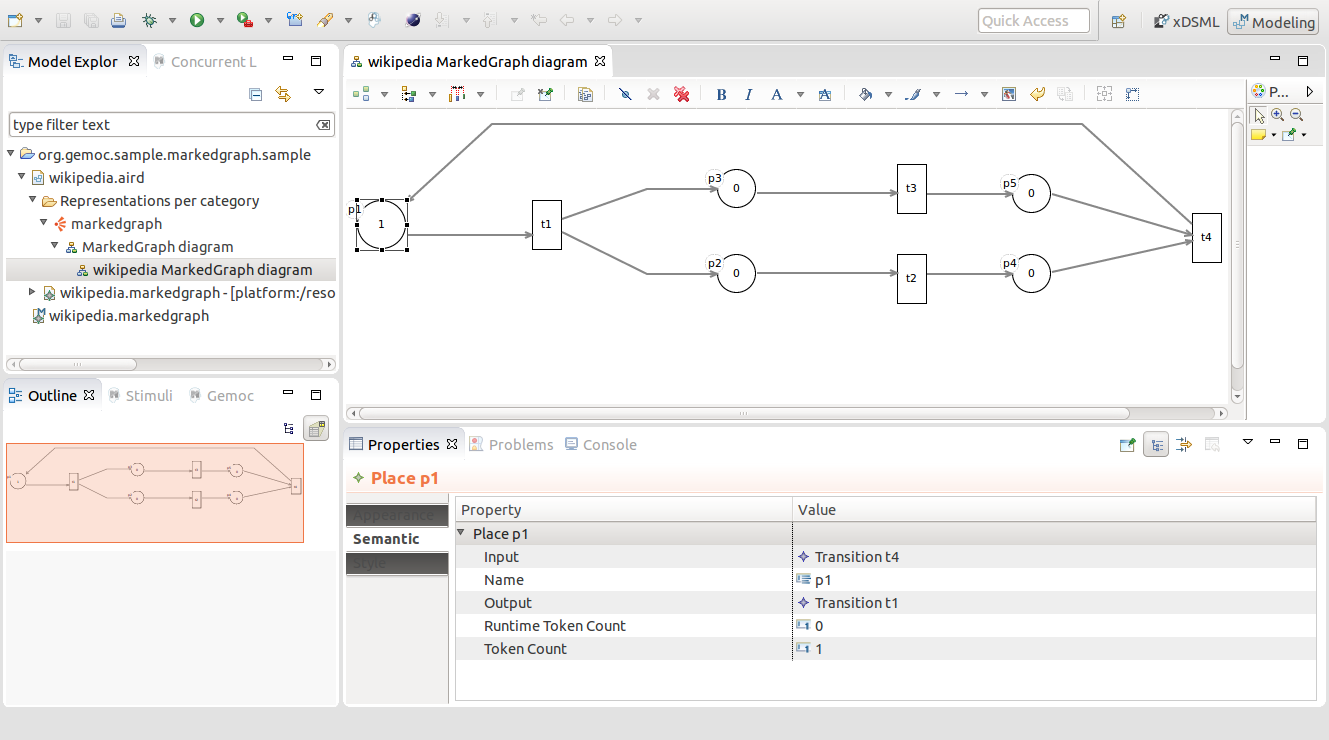
The properties view (bottom right) allow to see the properties on an element. We can see that a place object has the "Runtime Token Count" properties (the added ED).
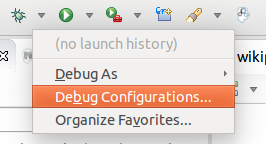
- Select Debug / Debug Configurations
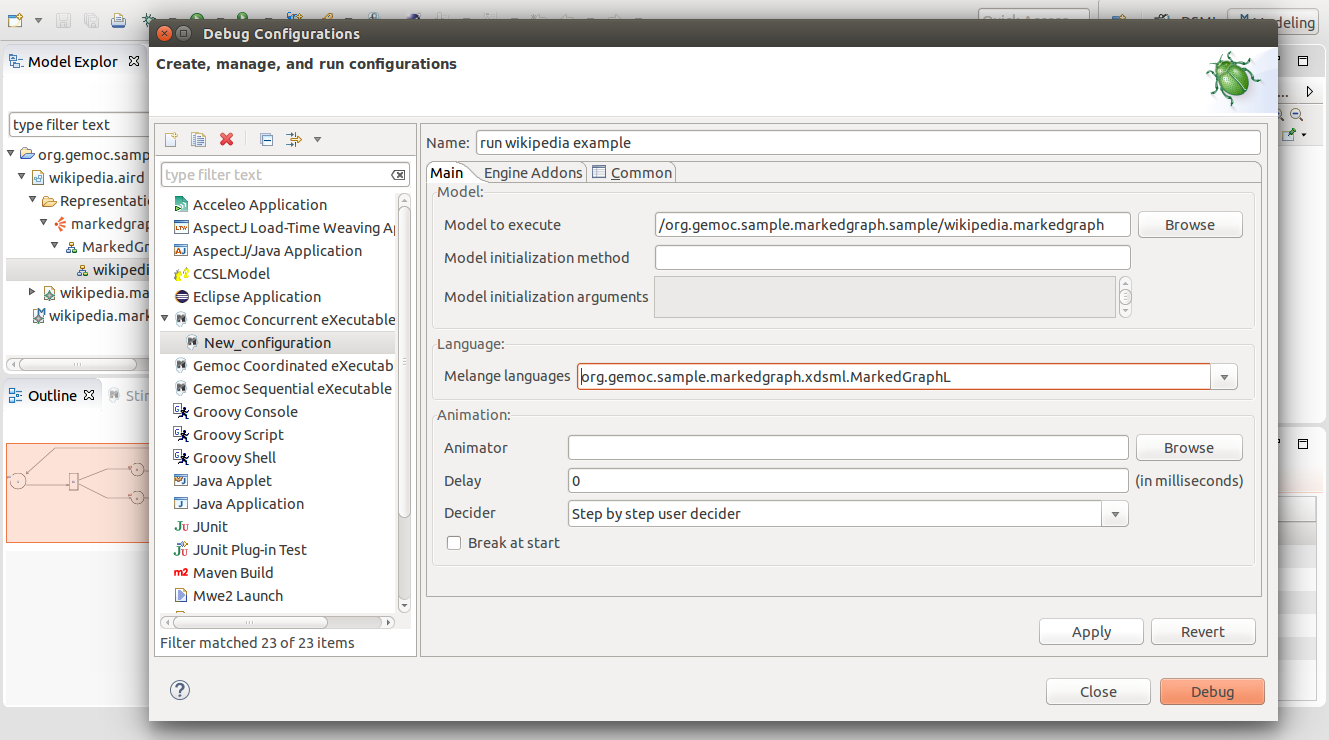
- Double click on "Gemoc Concurrent eXecutable Model"
- Change the name of the new configuration to "run wikipedia example"
- Browse to select the model to run (wikipedia.markedgraph)
- Select its language (xDSML field): org.gemoc.sample.markedgraph.xdsml.MarkedGraphL
- Check that the "Decider" is set to "Step by step user decider" (the user will decide which well be the next step to execute).
- Click on "Debug"
We can now run the "gemoc" configuration.
It selects the different views related to the execution on an xDSML model.
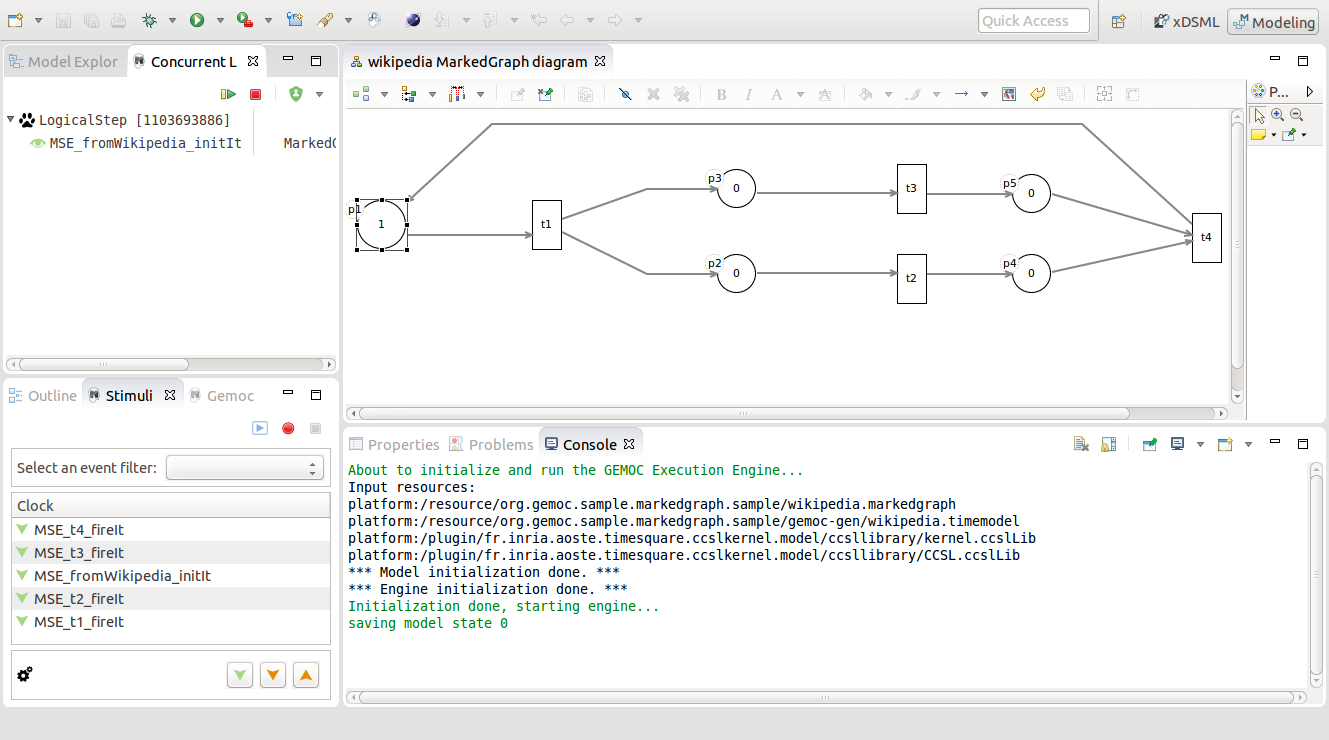
- Logical Steps Decider (top left): the list of the logical steps that may be selected at this execution step. For each step, the trigerred MSE are displayed on the left and the associated EF on the right. The stimuli manager can be used to stop the GEMOC engine, and thus the execution (red button).
- Stimuli Manager (bottom left): the list of MSE.
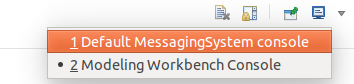
- Console (bottom right): several consoles are available. The displayed one is the "Modeling Workbench Console" which reports that the GEMOC Execution has benne started. Change it to the "Default MessagingSystem Console" (click on the arrow near the console symbol). Clear it.
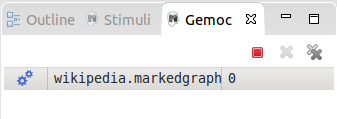
- Gemoc Engine Status (with Stimuli Manager): the list on the running GEMOC engines. The red button stops the selected engine.
As we have not yet defined any animation for the MarkedGraph Language, there will be no animation and the graphical visualization will not change.
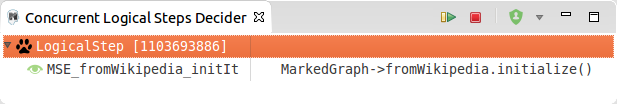
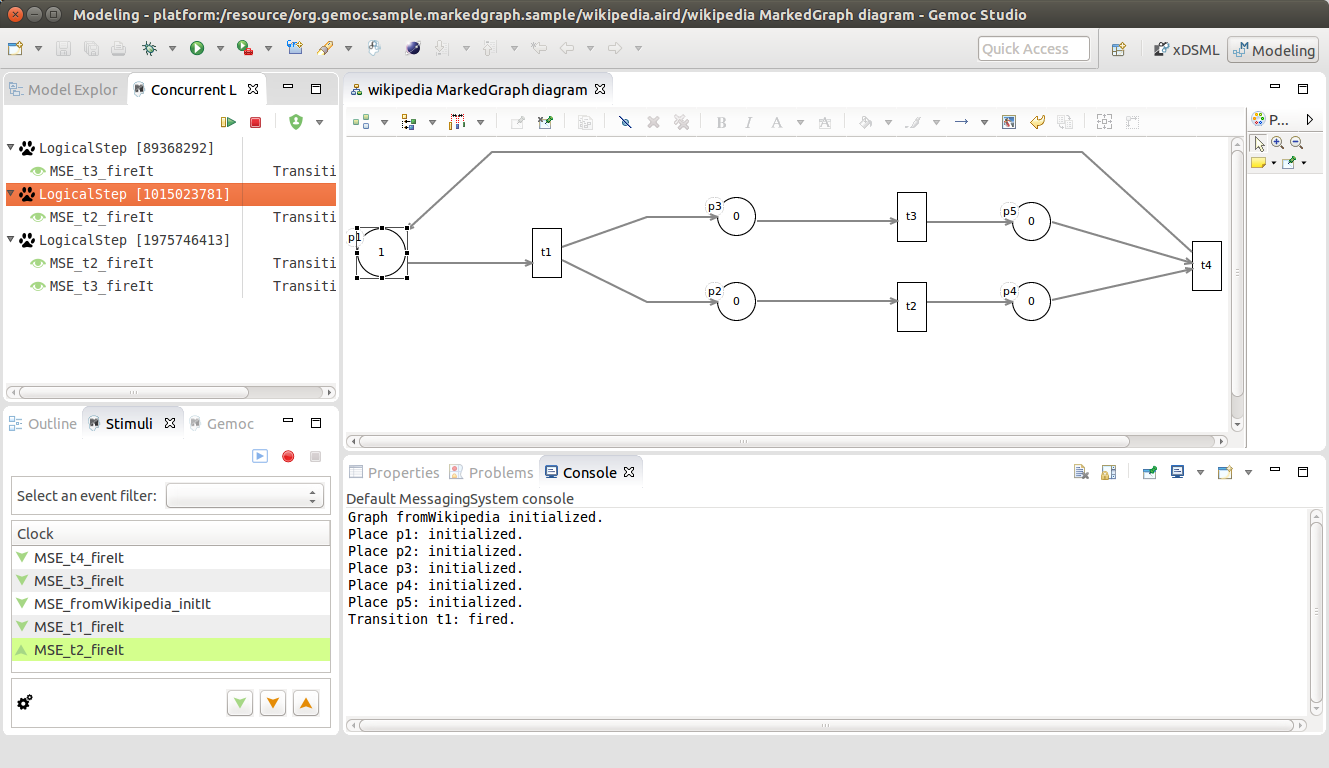
The Logical Steps view, presents the possible steps, and for each step, the MSE that will occur if it is selected.
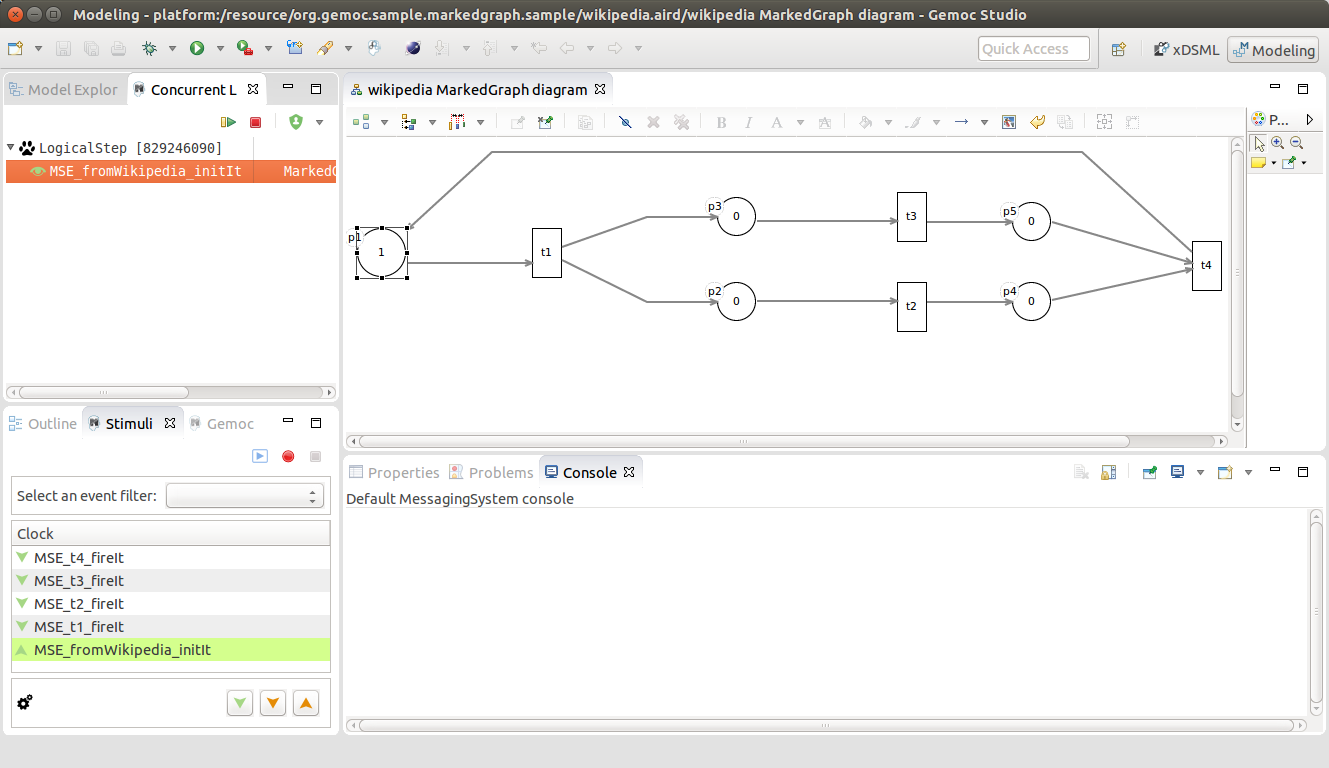
Double-click on a Logical Step to choose it. The corresponding MSEs occur and trigger the associated execution functions (EF) which make the state of the model evolve. Here, we will see traces in the Console are the EF we have defined print messages. The first MSE was initIt, which init the Graph and all its places (by initializing the runtime token count with the token count). The is then only one possible step: fireIt applied on t1 (__MSE_ta_fireIt).
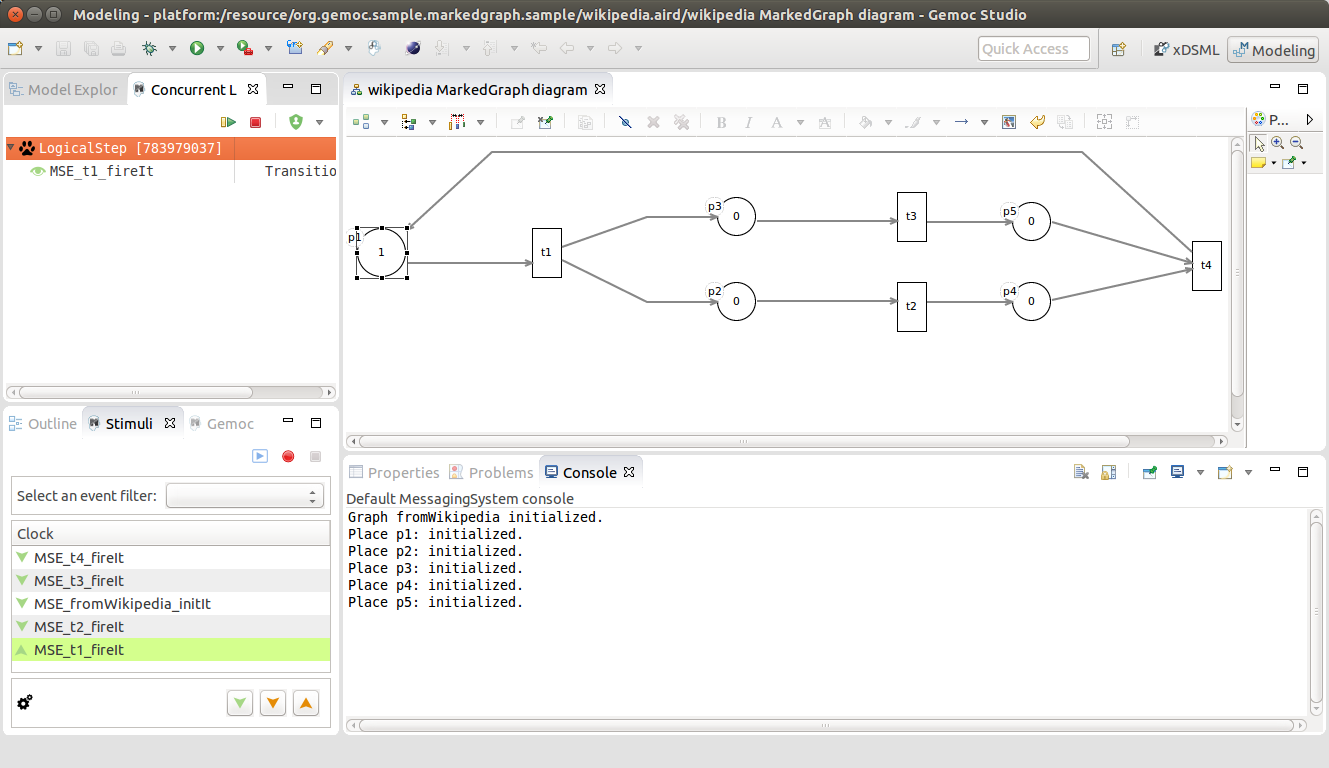
Then, we can select a new logical step and so one. In the following screenshots, we have first selected the t1 transition, and then the t2 transition.
To stop the execution, simply click on the red button in the Logical Steps Decider view (or in the Gemoc Engines view).
During the execution of a Marked Graph model, we want to visualize :
- the number of tokens in any place: the runtime token count will be printed in the circle of one place.
- the firable transitions: they will be drawn in green.
As the animation view is close to the graphical concrete syntax, we extend the existing diagram description.
First, we will define in the Language Workbench a graphical representation based on the graphical Marked Graph syntax thanks to the wizard called "Create Animator Project for language", in whichwe will add a layer to describe the graphical animation of a Marked Graph model.
Then we will be to able to visualize the states of mobel being executed in the MarkedGraph Modeling Workbench.
Keep the MarkedGraph Modeling Workbenchrunning and come back to the Language Workbench (first Gemoc Studio).
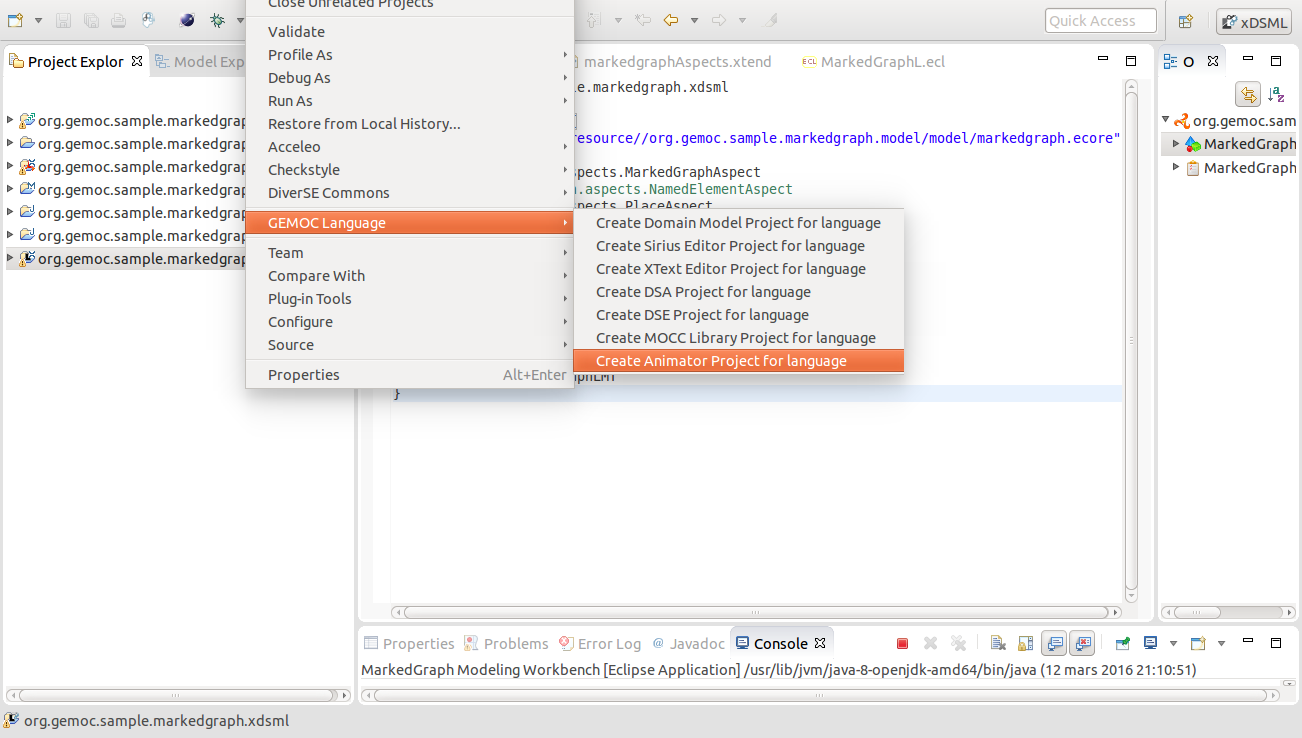
Rigth-click on any file of the org.gemoc.sample.markedgraph.xdsml project and select GEMOC Language > Create Animator Project for language.
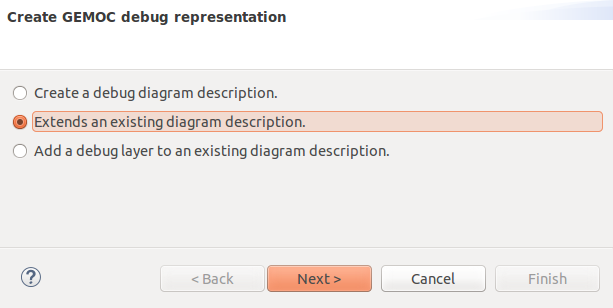
On the first screen of the wizad, select "Extends an existing diagram description".
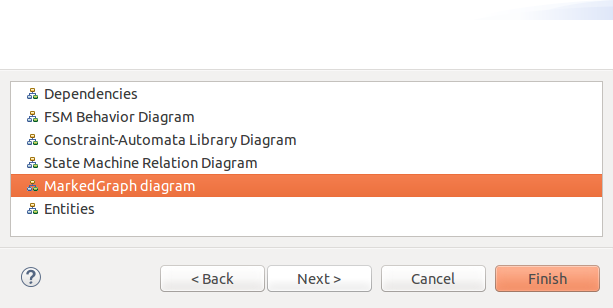
Select the viewpoint to extend "MarkedGraph diagram".
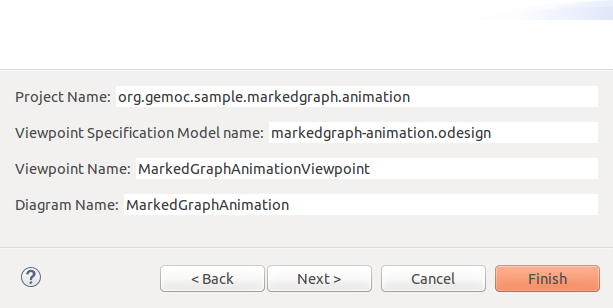
Finally, we can fill in the Project Name in which the newly creating viewpoint file will take place (org.gemoc.sample.markedgraph.animation), the name of the viewpoint file (markedgraph-animation.odesign), the viewpoint name (MarkedGraphAnimationViewpoint) and the diagram name (MarkedGraphAnimation).
The last screen allows to choose the name of the layer to be created. Debug is a good name.
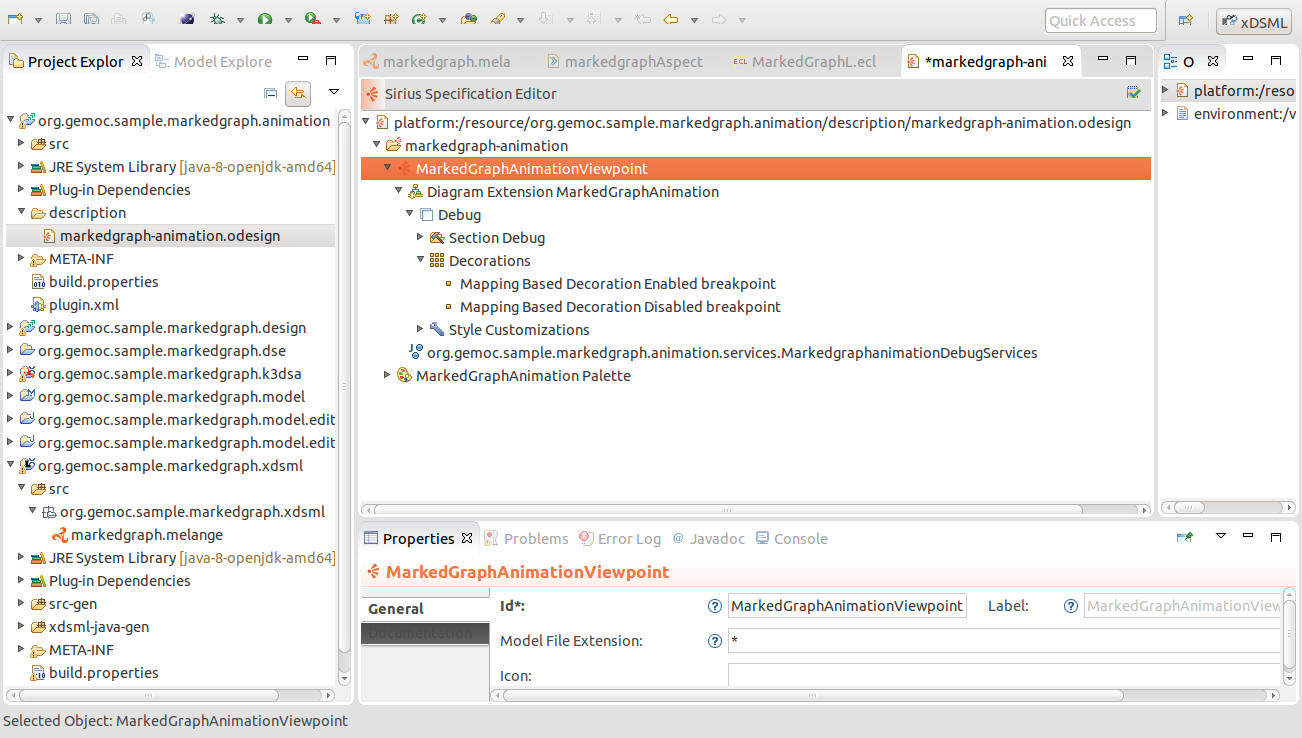
Press Finish to create the project. The markedgraph-animation.odesign file is opened.
Open the markedgraph-animation.odesign file and unfold its content.
To be able to complete the definition of the odesign file, we first need to load the existing markedgraph.odesign as a resource :
- Right click in the markedgraph-animation.odesign editor to select Load Resource….
- Select Browse workspace…
- Select markedgraph.odesign in the org.gemoc.sample.markedgraph.design project
- Click OK
- Click OK
After the debug presentation has been defined, we can complete it to add an animation layer.
- Right click on "Diagram extension MarkedGraph" to select New Diagram Element / Additional Layer.
- Set its "id" to "Animation".
- Right click on "Animation" to select "New Customization / Style Customizations".
- Right click on "Style Customizations" to select "New Customization / Style Customization".
On "Style Customization", set the "Predicate Expression" to:
[self.eGet('inputs')->forAll(p | p.eGet('runtimeTokenCount').toString().toInteger() > 0) /]- Right click on "Style Customization" to select "New Customization / Property Customization (by selection)"
- For "Applied On" property, select "Square white".
- For "Property Name", set "color" (completion is available with CTRL-SPACE)
- For "Value Selection", set "light_green"
Perform the same action as above to set the background color of places to yellow.
You have to select the first element named "ecliple white" (the second one is used to diplay the name).
- Right click on "Style Customization" to select "New Customization / Property Customization (by expression)"
- For "Applied On" property, select the first "Ellipse white".
- For "Property Name", set "labelExpression" (completion is available with CTRL-SPACE)
- For "Value Selection", set "feature:runtimeTokenCount"
- Right click on "MarkedGraphAnimationViewpoint" to select "New Extension / Java Extension".
- Set "Qualified Class Name" to "org.gemoc.sample.markedgraph.animation.services.MarkedgraphAnimationServices".
In the project, org.gemoc.sample.markedgraph.animation project, in "src/org.gemoc.sample.markedgraph.animation.services", copy the MarkedgraphDebugServices.java file to MarkedgraphAnimationServices.java, and edit the file to
- replace AbstractGemocDebuggerServices by AbstractGemocAnimatorServices in its source code (two times: import and extends)
- replace "Debug" by "Animation" (two times).
The executable MarkedGraph Language is now defined with a graphical visualization. We can come back to the MarkedGraph Modeling Workbench to run it.
First of all, we need to restart (File > restart) the MarkedGraph Modeling Workbench to take into account the modifications of the MarkedGraph xDSML.
Right click on wikipedia.aird and select Viewpoints Selection. If Viewpoints Selection is not in the menu, double-click on the file wikipedia.aird.
Select Viewpoint Selection. 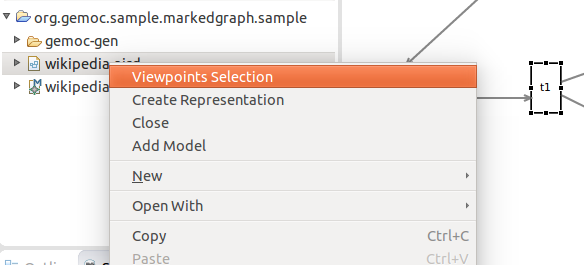
Select MarkedGraphAnimationViewpoint. 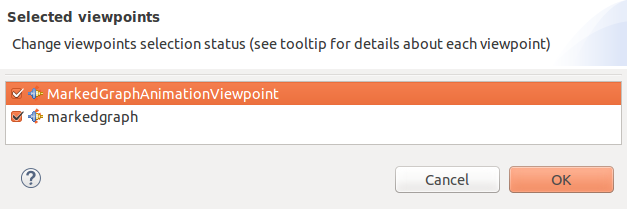
You can now open the wikipedia graphical representation (wikipedia.air / Representation per category / markedgraph / MarkedGraph diagram / wikipedia MarkedGraph diagram). On the visualization, all places should be with a yellow background.
Open the "run wikipedia example" configuration" (Debug > Debug Configuration…). Complete the "Animator" field with "/org.gemoc.sample.markedgraph.sample/wikipedia.aird" (use Browse to select it).
First, we will create a run configuration. Select "run / run Configurations"
To be able to debug a model, we need to complete the org.gemoc.sample.markedgraph.animation project using the Language Workbench.
The "Debug" layer which has been generated has to be completed and corrected. A future version of the GEMOC Studio will tackle down the burdon.
On the "Mapping Based Decoration Enabled breakpoint" and "Mapping Based Decoration Disabled breakpoint" of the "Debug" layer, under "Decorations" element, select the "Place" and "Transition" element. Change "Position" to "North East".
It indicates that a breakpoint can be enabled or disabled on Place and Transition elements of a MarkedGraph model. It will be graphically shown as icon displayed in the corresponding graphical element, at the nort east.
In both mappings, change the directory of the icon from "org.gemoc.executionframework.extensions.sirius" to "org.gemoc.gemoc_heterogeneous_modeling_workbench.ui". Do the same change for the icons of "Operation Action Debug" and "Operation Action Toggle breakpoint".
- Change the "External Java Action Debug" of "Operation Action Debug" to "org.gemoc.execution.concurrent.ccsljavaengine.ui.debug.sirius.action.gemocDebugAs".
- Change the "External Java Action Debug" of "Operation Action Debug" to "org.gemoc.execution.concurrent.ccsljavaengine.ui.debug.sirius.action.GemocConcurrentToggleBreakpointAction".
- Edit the file "MarkedgraphanimationDebugServices.java" in "src/org/gemoc/sample/markedgraph/xdsml/animation/services" of the "org.gemoc.sample.markedgraph.animation" project to add the folowing method:
@Override
public String getModelIdentifier() {
	return org.gemoc.execution.concurrent.ccsljavaengine.ui.Activator.PLUGIN_ID+".debugModel";
}- The file contains an error. To correct it, double-click on "plugin.xml" (or META-INF/MANIFEST.MF), select "dependencies" and add "org.gemoc.execution.concurrent.ccsljavaengine.ui" plug-in. Save it.
- Restart the MarkedGraph Modeling Workbench (File > restart on the second eclipse).
- Run the wikipedia example (using debug > run wikipedia example).
- right click on p3, select Gemoc > Toogle breakpoint. Do the same for t4. Nothing happens (symbols for breakpoints will be updated when running the next step).
- select a logical step. A green circle has appeared at the top right (north east) for the p3 place and t4 transition.
- select "Resume" to exit step by step mode and run the example
- execution stops on t4 transition and eclipse asks for switching to the Debug perspective. We can notice that the breakpoint on p3 has no effect because there is no EF associated on a place. On the contrary, the execution stopped when EF of the t4 transition was about to fire.
To improve readability of the ECL file and also to favor capitalization and reuse of MoCC elements, it is possible (and encouraged) to define libraries. Those libraries looks like the predefined ones that we have already used like kernel.lib and CCSL.lib.
Using the GEMOC Studio, we start by defining a MoCCML project. In the xDSML view, we select Behavioral definition / MoCC definition library to create this new project.
We can then define in this project the following markedgraph.ccslLib file. TODO: To be corrected.
The file markedgraph.ccslLib defining a MoCCML library.
Unresolved directive in GuideTutorialMarkedGraph.asciidoc - include::MarkedGraph/markedgraph.ccslLib[Definition of a MoCCML library]
To use this new library, we only have to import it at the beginning of the ECL file and the we can use it as kernel.lib and CCSL.lib libraries.
Here is the new ECL file.
The file MarkedGraphL.ecl using the MoCCML library.
import 'platform:/resource/org.gemoc.sample.markedgraph.model/model/markedgraph.ecore'

ECLimport "platform:/plugin/fr.inria.aoste.timesquare.ccslkernel.model/ccsllibrary/kernel.ccslLib"
ECLimport "platform:/plugin/fr.inria.aoste.timesquare.ccslkernel.model/ccsllibrary/CCSL.ccslLib"
ECLimport "platform:/resource/org.gemoc.sample.markedgraph.mocc/mocc/markedgraph.moccml"

package markedgraph

	context MarkedGraph
		def: initIt: Event = self.initialize()

	context Transition
		def: fireIt: Event = self.fire()

	context Place
		inv placeReadAndWrite:
			let delay: Integer = self.tokenCount in
				Relation placeReadWrite(self.output.fireIt, self.input.fireIt, delay)

	context MarkedGraph
        inv initFirst:
                let firstInit : Event = Expression OneTickAndNoMore(self.initIt) in
                let allFire : Event = Expression Union(self.transitions.fireIt) in
                let firstOfAllFire : Event = Expression OneTickAndNoMore(allFire) in
                Relation Precedes(firstInit, firstOfAllFire)

        inv onlyOneInit:
                let firstInit2 : Event = Expression OneTickAndNoMore(self.initIt) in
                Relation Coincides(self.initIt, firstInit2)

endpackage
Sometimes, it may be easier to define the MoCC using automata. For example, we can see a place as something on which we can read a token (ont output transition reads one token) or we can write a token (one input transition writes one token). A token can only be read if there is at least one in the place. Initially, there is as much token in the place as in the initial token count of the place.
For explanations on how to use the MoCCML editor, please refer to the GEMOC manual.
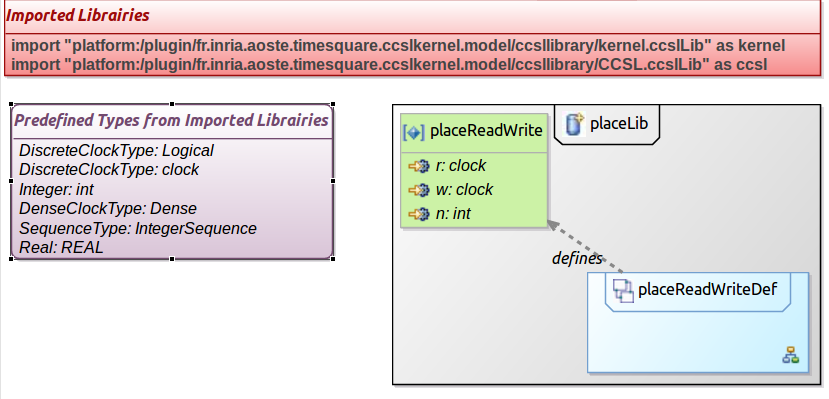
We first define the declaration of a relation (placeReadWrite). Here after is its graphical representation. This relation is parameterized by the r clock (some one how wants to read a token), the w clock (someone how wants to write a token, and n the initial count of token in the place).
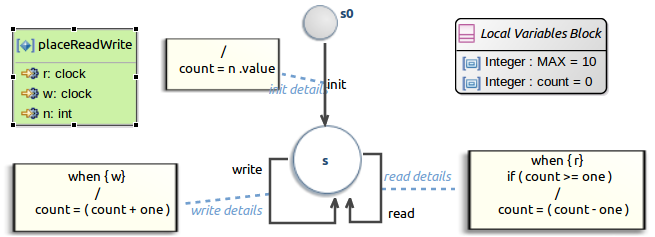
Then we can define this relation. Here after is the resulting automaton. The local variable count represent the number of tokens in this place. s0 is the initial state. The action on the transition from s0 to s initialize count with n (the parameter). The two reflexive transitions on s explain what happens when w or r occurs. The write transition is fired when w occurs and a token is assed in the place (count is incremented). The read transition is fired when r occurs. It removes a token and thus decrements count. A guard prevents the read transition to be fired if there is not at liste one token in the place (count >= one).
Here is the textual representation of this constraint automata.
Textual representation of the constraint automata.
AutomataConstraintLibrary markedgraph{
	import "platform:/plugin/fr.inria.aoste.timesquare.ccslkernel.model/ccsllibrary/kernel.ccslLib" as kernel;
	import "platform:/plugin/fr.inria.aoste.timesquare.ccslkernel.model/ccsllibrary/CCSL.ccslLib" as ccsl;

	RelationLibrary placeLib {

		AutomataRelationDefinition placeReadWriteDef[placeReadWrite]{

			variables {
				Integer MAX = 10
				Integer count = 0

			}

			init: s0

			from s0 to s : init
			-> (do count = n.value)

			from s to s : read
			-> ( when r if( count >= one) do count = (count - one))

			from s to s : write
			-> ( when w do count = (count + one))

			State s0 (out : init)
			State s( in : read, write, init
				out : write, read
			)

		}

		RelationDeclaration placeReadWrite(r:clock, w: clock, n: int)
	}
}